2.11. Extension: Multiple Logistic Regression#
In multiple linear regression we have multiple input variables. These linear regression models are of the form
Just like multiple linear regression, we can have multiple logistic regression. These logistic models are of the form
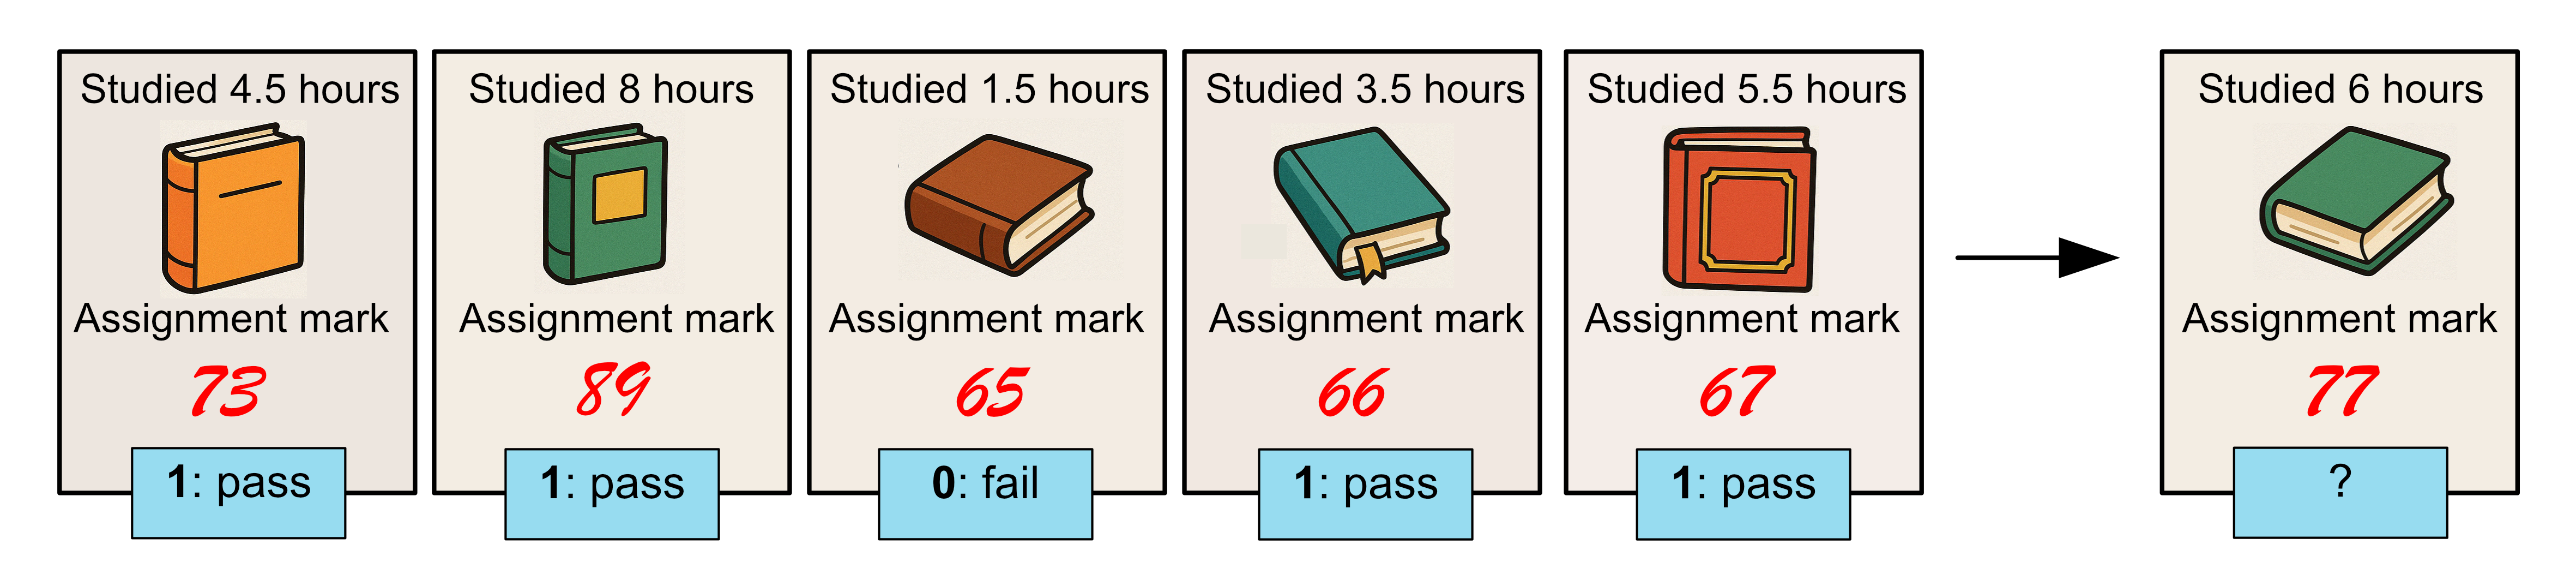
Let’s consider the following dataset:
Time Spent Studying (hours) |
Assignment Mark (%) |
Exam (Fail 0/Pass 1) |
|---|---|---|
4.5 |
73 |
1 |
8 |
89 |
1 |
1.5 |
65 |
0 |
3.5 |
66 |
1 |
5.5 |
67 |
1 |
3 |
65 |
0 |
6.5 |
92 |
1 |
In this case we have 2 pieces of information
The amount each student studied
The assignment mark of each student
And our goal is to predict whether the student will pass or fail the exam.
Just like with our linear regression model the main difference in the code is
that our input variable x is a 2D array with \(n\) rows, one for each
sample in the dataset and 2 columns since we now have 2 input
variables.
Below is a complete example, including a prediction for a test student who studied 6 hours and has an assignment mark of 77.
from sklearn.linear_model import LogisticRegression
import pandas as pd
import numpy as np

data = pd.read_csv("pass_fail_assignment.csv")
x = data[["Time Spent Studying (hours)", "Assignment Mark (%)"]].to_numpy()
y = data["Exam Result"].to_numpy()

logistic_reg = LogisticRegression()
logistic_reg.fit(x, y)

x_test = np.array([[6, 77]])
print("predicted result: {}".format(logistic_reg.predict(x_test)))
predicted result: [1]
Code Challenge: Extension: Multiple Logistic Regression
In addition to the hours of sunshine we also have humidity information. Let’s try adding this additional information into our logistic regression model. Then, we can evaluate this new model on the test data shown below by calculating the accuracy of the model.
Sunshine |
Humidity |
RainTomorrow |
|---|---|---|
2.2 |
56 |
0 |
5.0 |
70 |
0 |
7.3 |
54 |
0 |
3.2 |
77 |
1 |
1.7 |
82 |
1 |
4.1 |
39 |
0 |
5.5 |
47 |
1 |
Instructions
Copy and paste your code from Predicting With A Logistic Regression Model using
rain.csv.Update training data
Modify
xso that it contains both the'Sunshine'and'Humidity'columns.Don’t modify
y
Fit the
LogisticRegressionmodel to the augmented training dataUsing the table above, add the Humidity data as another column to your test data
Use .predict to predict whether it will rain the following day on the test data
Create an array storing the actual classes of each test sample (you can copy this from Extension: Further Classification Metrics).
Calculate the accuracy on the test data
Print the accuracy
Your output should look like this:
Accuracy: X.XX
Calculating Accuracy
To calculate the accuracy:
Create a variable to hold the total number of correct predictions
Loop over each prediction
If the prediction matches the real value then increase the number of correct predictions by 1
Divide the sum by the length of the test set
Solution
Solution is locked